Once a project has been clearly defined, the next step is to understand how the process actually performs today. The Measure phase focuses on gathering reliable data so the team can see the process objectively rather than relying on assumptions or anecdotal experiences.
Many improvement efforts fail because teams jump directly to solutions without first understanding the current condition. Staff may believe they know the source of a problem, but when data is collected, the true causes often appear elsewhere.
The Measure phase answers questions such as:
- How well is the process currently performing?
- How often do problems occur?
- Where do delays or defects happen most frequently?
- How much variation exists in the process?
By establishing baseline measurements, the team creates a starting point that allows improvements to be evaluated later in the project.
Why Measurement Matters
In complex environments like healthcare, processes involve many people, steps, and systems. Without reliable data, improvement efforts can easily focus on the wrong issues.
For example, staff may believe that delays occur primarily during patient intake. However, when data is collected, it may reveal that the largest delays occur during laboratory processing or discharge documentation.
Lean Six Sigma emphasizes the principle:
"You cannot improve what you cannot measure."
Measurement allows teams to:
- Quantify the size of the problem
- Identify where variation occurs
- Prioritize improvement opportunities
- Evaluate whether solutions actually work
Establishing Baseline Performance
The first major goal of the Measure phase is to determine baseline performance, which represents how the process currently operates before any improvements are made.
Baseline metrics allow teams to answer an important question later:
Did our changes actually improve the process?
Healthcare Example: Emergency Department Wait Time
Suppose a facility wants to reduce the time patients wait before seeing a provider.
The team collects data over a two-week period and records the time from patient arrival to provider evaluation.
Baseline findings may look like this:
| Metric |
Value |
| Average wait time | 70 minutes |
| Minimum wait time | 12 minutes |
| Maximum wait time | 165 minutes |
| Percentage seen within 30 minutes | 22% |
This baseline now provides a clear picture of current performance and will serve as the reference point for future improvements.
Collecting Reliable Data
During the Measure phase, teams gather data to better understand the process. However, not all data collection methods are equally reliable.
It is important that the data collected is:
- Accurate - reflects the real process
- Consistent - measured the same way each time
- Relevant - directly related to the problem
Common data sources in healthcare include:
- Electronic health record (EHR) timestamps
- Incident reports
- Operational dashboards
- Staff observations
- Manual tracking sheets
Healthcare Example: Tracking Medication Administration Delays
A facility suspects that medication administration is often delayed during evening shifts.
The improvement team collects data for two weeks and records:
- Scheduled medication time
- Actual administration time
- Unit where the medication was given
- Staffing levels during the shift
This data helps reveal whether delays are random or connected to specific conditions.
Operational Definitions
Before collecting data, teams must establish clear definitions for what is being measured. Without these definitions, different people may interpret the measurement differently.
This concept is called creating an operational definition.
An operational definition ensures that everyone measures the same event in the same way.
Healthcare Example: Defining "Patient Wait Time"
If a facility measures wait time, several interpretations may exist:
- Time from arrival to triage
- Time from arrival to provider evaluation
- Time from triage to treatment room placement
To avoid confusion, the team defines wait time as:
"The time between the patient's recorded arrival in the electronic health record and the time a provider begins the initial evaluation."
With this definition, all measurements will be consistent and comparable.
Process Flow Visualization
Another important activity during the Measure phase is examining the process flow in greater detail.
While the Define phase typically uses a high-level process map, the Measure phase often expands this into a more detailed workflow that shows each step in the process.
These maps help teams:
- Identify delays
- Detect unnecessary steps
- Understand handoffs between departments
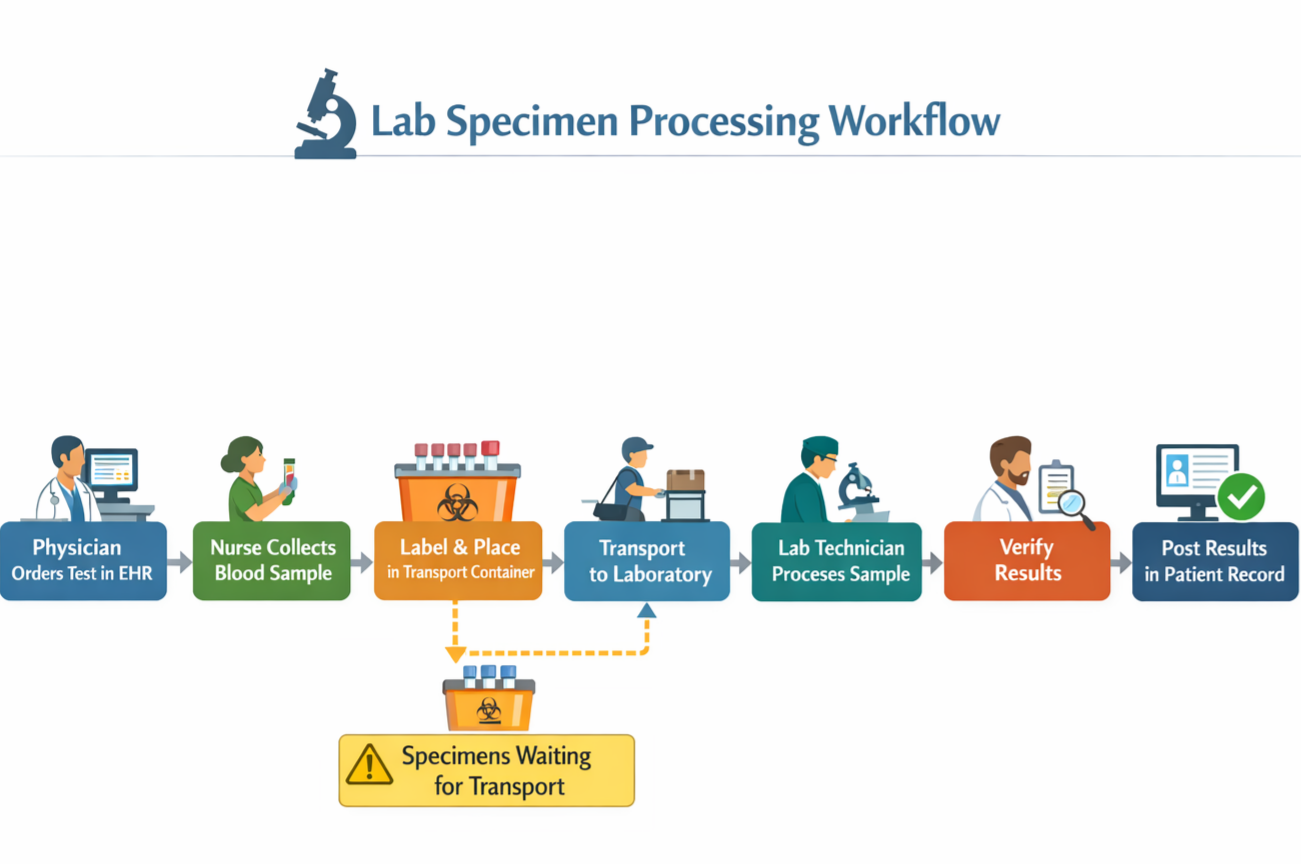
Healthcare Example: Laboratory Specimen Processing
A medical facility laboratory team maps the process for blood test results.
The detailed process map includes:
- Physician orders lab test in EHR
- Nurse collects blood sample
- Sample labeled and placed in transport container
- Specimen transported to laboratory
- Sample logged into lab information system
- Lab technician processes sample
- Results verified by technician
- Results posted to patient record
When the team studies the map alongside collected data, they discover that most delays occur between steps 3 and 4, when specimens wait for scheduled transport to the laboratory.
This insight would not have been obvious without mapping and measurement.
Visualizing Data
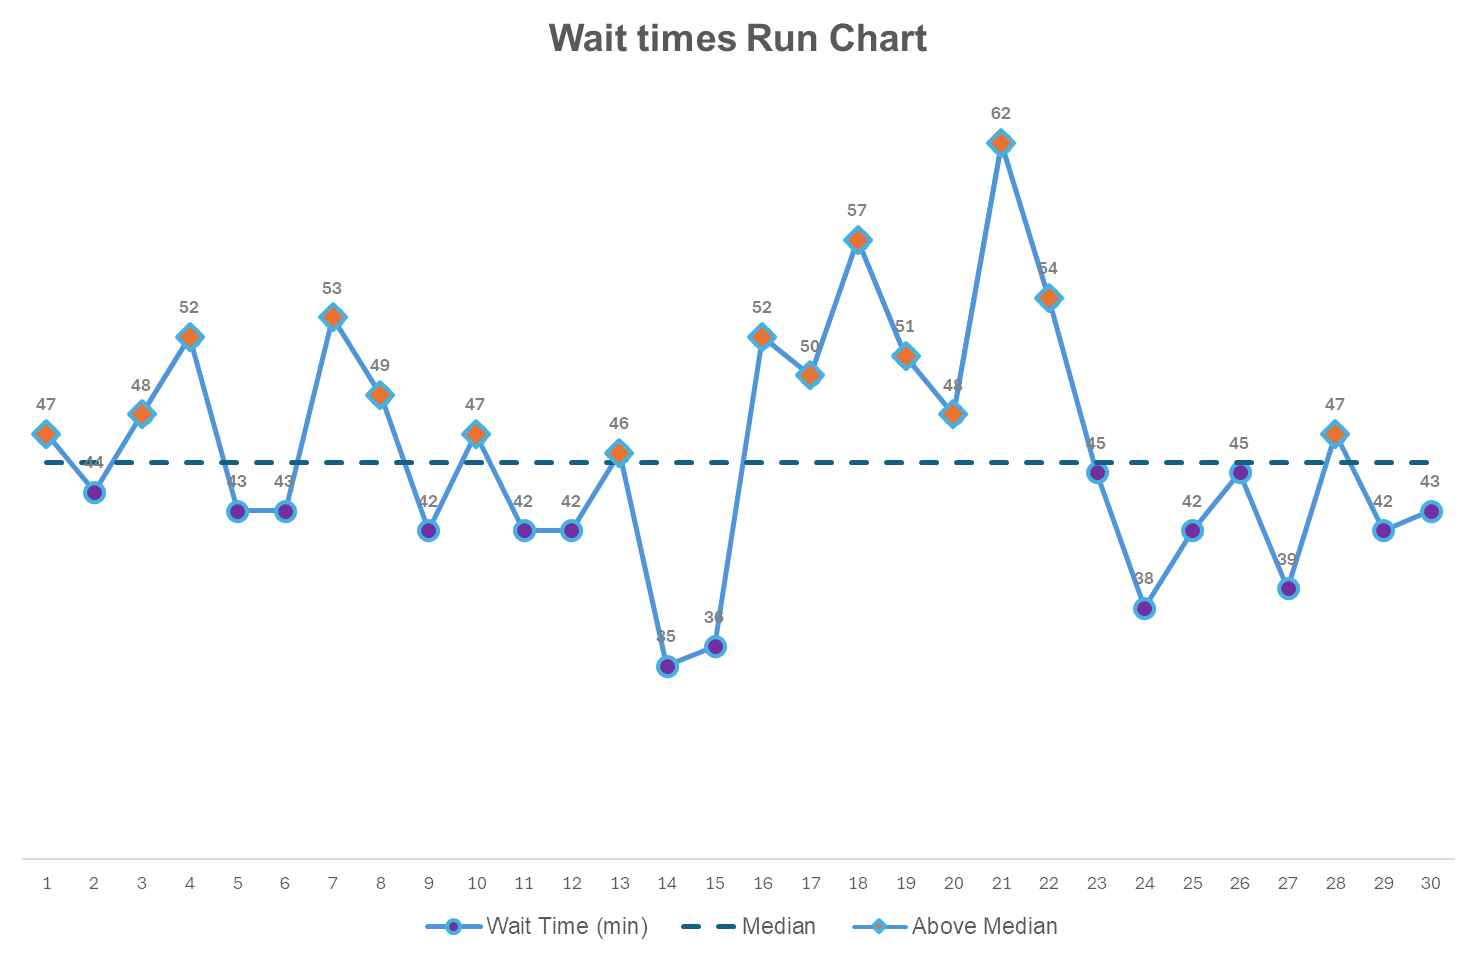
Once data has been collected, it is often helpful to visualize it using simple charts and graphs. Visual tools make it easier to identify patterns, trends, and unusual variation.
Common visualizations include:
- Bar charts
- Line charts
- Histograms
- Run charts
- Pareto charts
Healthcare Example: Identifying Delay Patterns
Suppose the medical department collects wait time data over several weeks.
A run chart may reveal that:
- Wait times spike during late afternoon hours
- Weekend wait times are significantly longer
- Certain days consistently experience higher patient volume
These visual patterns can guide the team toward the most important areas for investigation during the Analyze phase.
Understanding Process Variation
Processes rarely perform the same way every time. Differences in workload, staffing, and environmental conditions can cause variation in results.
Some variation is normal, while other variation indicates deeper problems.
For example:
- Small fluctuations in patient arrival times are expected.
- Large spikes in wait time during certain shifts may indicate staffing shortages or workflow issues.
By collecting enough data, teams can distinguish between random variation and systemic problems that require improvement.
Avoiding Common Measurement Pitfalls
The Measure phase requires careful attention to data quality. Teams should be aware of several common mistakes.
Collecting Too Little Data
If the sample size is too small, conclusions may not represent the true process performance.
Measuring the Wrong Thing
Teams sometimes collect data that is easy to obtain rather than data that directly relates to the problem.
Inconsistent Measurement
If staff measure events differently, the data may become unreliable.
Focusing Only on Averages
Averages alone can hide important variation within a process. Understanding the full range of outcomes provides a clearer picture.
Avoiding these pitfalls ensures that the data collected during the Measure phase can support meaningful analysis later.
Preparing for the Analyze Phase
By the end of the Measure phase, the team should have a clear understanding of how the current process performs.
Key outputs from this stage typically include:
- Baseline performance metrics
- Documented data collection methods
- Operational definitions for measurements
- Detailed process maps
- Visual summaries of collected data
With this information, the team is prepared to move into the Analyze phase, where the focus shifts to identifying the root causes of problems uncovered during measurement.
Chapter Summary
The Measure phase focuses on understanding the current performance of a process through reliable data collection.
During this stage, teams:
- Establish baseline performance metrics
- Collect accurate and consistent data
- Define operational measurement criteria
- Map the detailed process workflow
- Visualize patterns and variation in the data
These activities allow teams to move beyond assumptions and develop a data-driven understanding of the process.
With reliable measurements in place, the team is now ready to investigate why problems occur, which is the focus of the next stage in the DMAIC cycle: Analyze.